Readers may be aware of the Changing Cost of Living study, which we carried out in this team from Autumn 2022 to Autumn 2023. I wrote an earlier post here explaining what the study was and why we did it. The study is now complete and the first paper is available here as a preprint.
Briefly, we were interested in how people’s mental health (notably for today’s purposes, anxiety and depression) related to their financial circumstances. Many, many previous studies have found that people with worse financial situations are more anxious and more depressed. So what could we possibly add?
The problem with the literature on income and mental health is not one of knowing whether there is an association; there is. It is knowing how to interpret this causally. There are three possibilities here:
- Having a low income causes anxiety and depression.
- Having anxiety and depression causes people’s incomes to decline, because their symptoms interfere with their ability to work or their career progression.
- Some other variable both causes anxiety and depression and causes income to decline. Anxiety, depression and low income find themselves mingling because they are all here as consequences of something else, be it genes or schooling or exposure to lead paint.
Causal understandings matter in social science, because they orient you to the place you should be intervening if you want to make human life better. Roughly speaking, the stronger pathway 1 is, the more you are pointed toward redistribution and the relief of poverty; the stronger pathway 2 is, the more valuable it seems to improve treatment for mental health conditions as the first priority; and it is unclear where pathway 3 points, but it is probably somewhere else.
Teasing apart the three causal pathways is challenging. The particular way we wanted to do it in the Changing Cost of Living study was through an intensive longitudinal study, in which the same people’s financial situations, anxiety and depression, were measured repeatedly and frequently over time. So, our participants (around 470 adults from the UK and France, towards the middle and lower end of the income distribution) filled in a financial diary every month, specifying all the sums that had come in in the previous month, and the main non-negotiable sums that had gone out (rent/mortgage, energy and water bills, local taxes). This allowed us to calculate an income-to-costs measure: what is the ratio of your incomings to your unavoidable outgoings? Over the period of the study, both incomes and particularly costs were changing a lot: this was a period of high inflation in things like energy bills, especially in the UK. The participants also filled in standard clinical measures of anxiety and depression every month.
These data allow us to ask a question about each person’s average position, and a question about their fluctuations, as follows:
- Average position: Were participants who, on average over the year, had lower income-to-costs ratios, more anxious and depressed on average over the year?
- Fluctuations: Was a given participant more anxious and depressed than usual following a month in which their income-to-cost ratio was worse than usual?
The average position question is the less interesting: I would have eaten my hat if there had been any other answer than ‘yes!’, and so indeed it proved.
The fluctuation question is interesting in the light of the three causal pathways outlined above. If pathway 3 is important and some third variable, genes or childhood experience or schooling, is responsible for the association between income and mental health, then there is really no reason for the fluctuations in income to be coupled to the fluctuations in mental health. So to the extent to which the answer to the fluctuations question is yes, this is probably picking up some kind of causal relation. (This is the relation known in social science as Granger causality, which is a kind of causality-lite. Really getting at causality in social science is hard – what really causes behaviour, after all? – but if wiggles in one variable produce wiggles in the other, that seems causalish in the way that the association between having an expensive coffee machine and liking opera does not).
Does the answer to the fluctuation question tell us anything about the relative importance of pathways 1 and 2? We argue that it does, especially because we studied fluctuations over the short timescale of one month. The reasoning is as follows. Let us say that an increase in your anxiety and depression leads your income to decline. That’s probably not going to happen on the timescale of a single month. A worsening of your symptoms could lead you to need time off; to move to part-time working; or to miss out on promotions you otherwise would have got. But these are the kinds of effects that will take months or years to accumulate. If my symptoms suddenly get worse, that might well show up in a worse financial situation in a year’s time, or 5 year’s time. But my income is unlikely to drop a lot this very month, not least because most employers give you sick pay at least for a while. So, we argue, if my financial situation has been worse just this very month, and I feel more anxious and depressed this very month, the most parsimonious conclusion is that I feel anxious and depressed as an immediate result of the financial situation; i.e. pathway 1 is the primary driver. This argument is not completely water-tight, but I think it is reasonable. In other words, the size of the fluctuation in anxiety and depression when income-to-costs fluctuates is a lower bound estimate of the causal effect of finances on these outcomes.
That build up was rather long; what about some results? Figure 1 summarises the data.
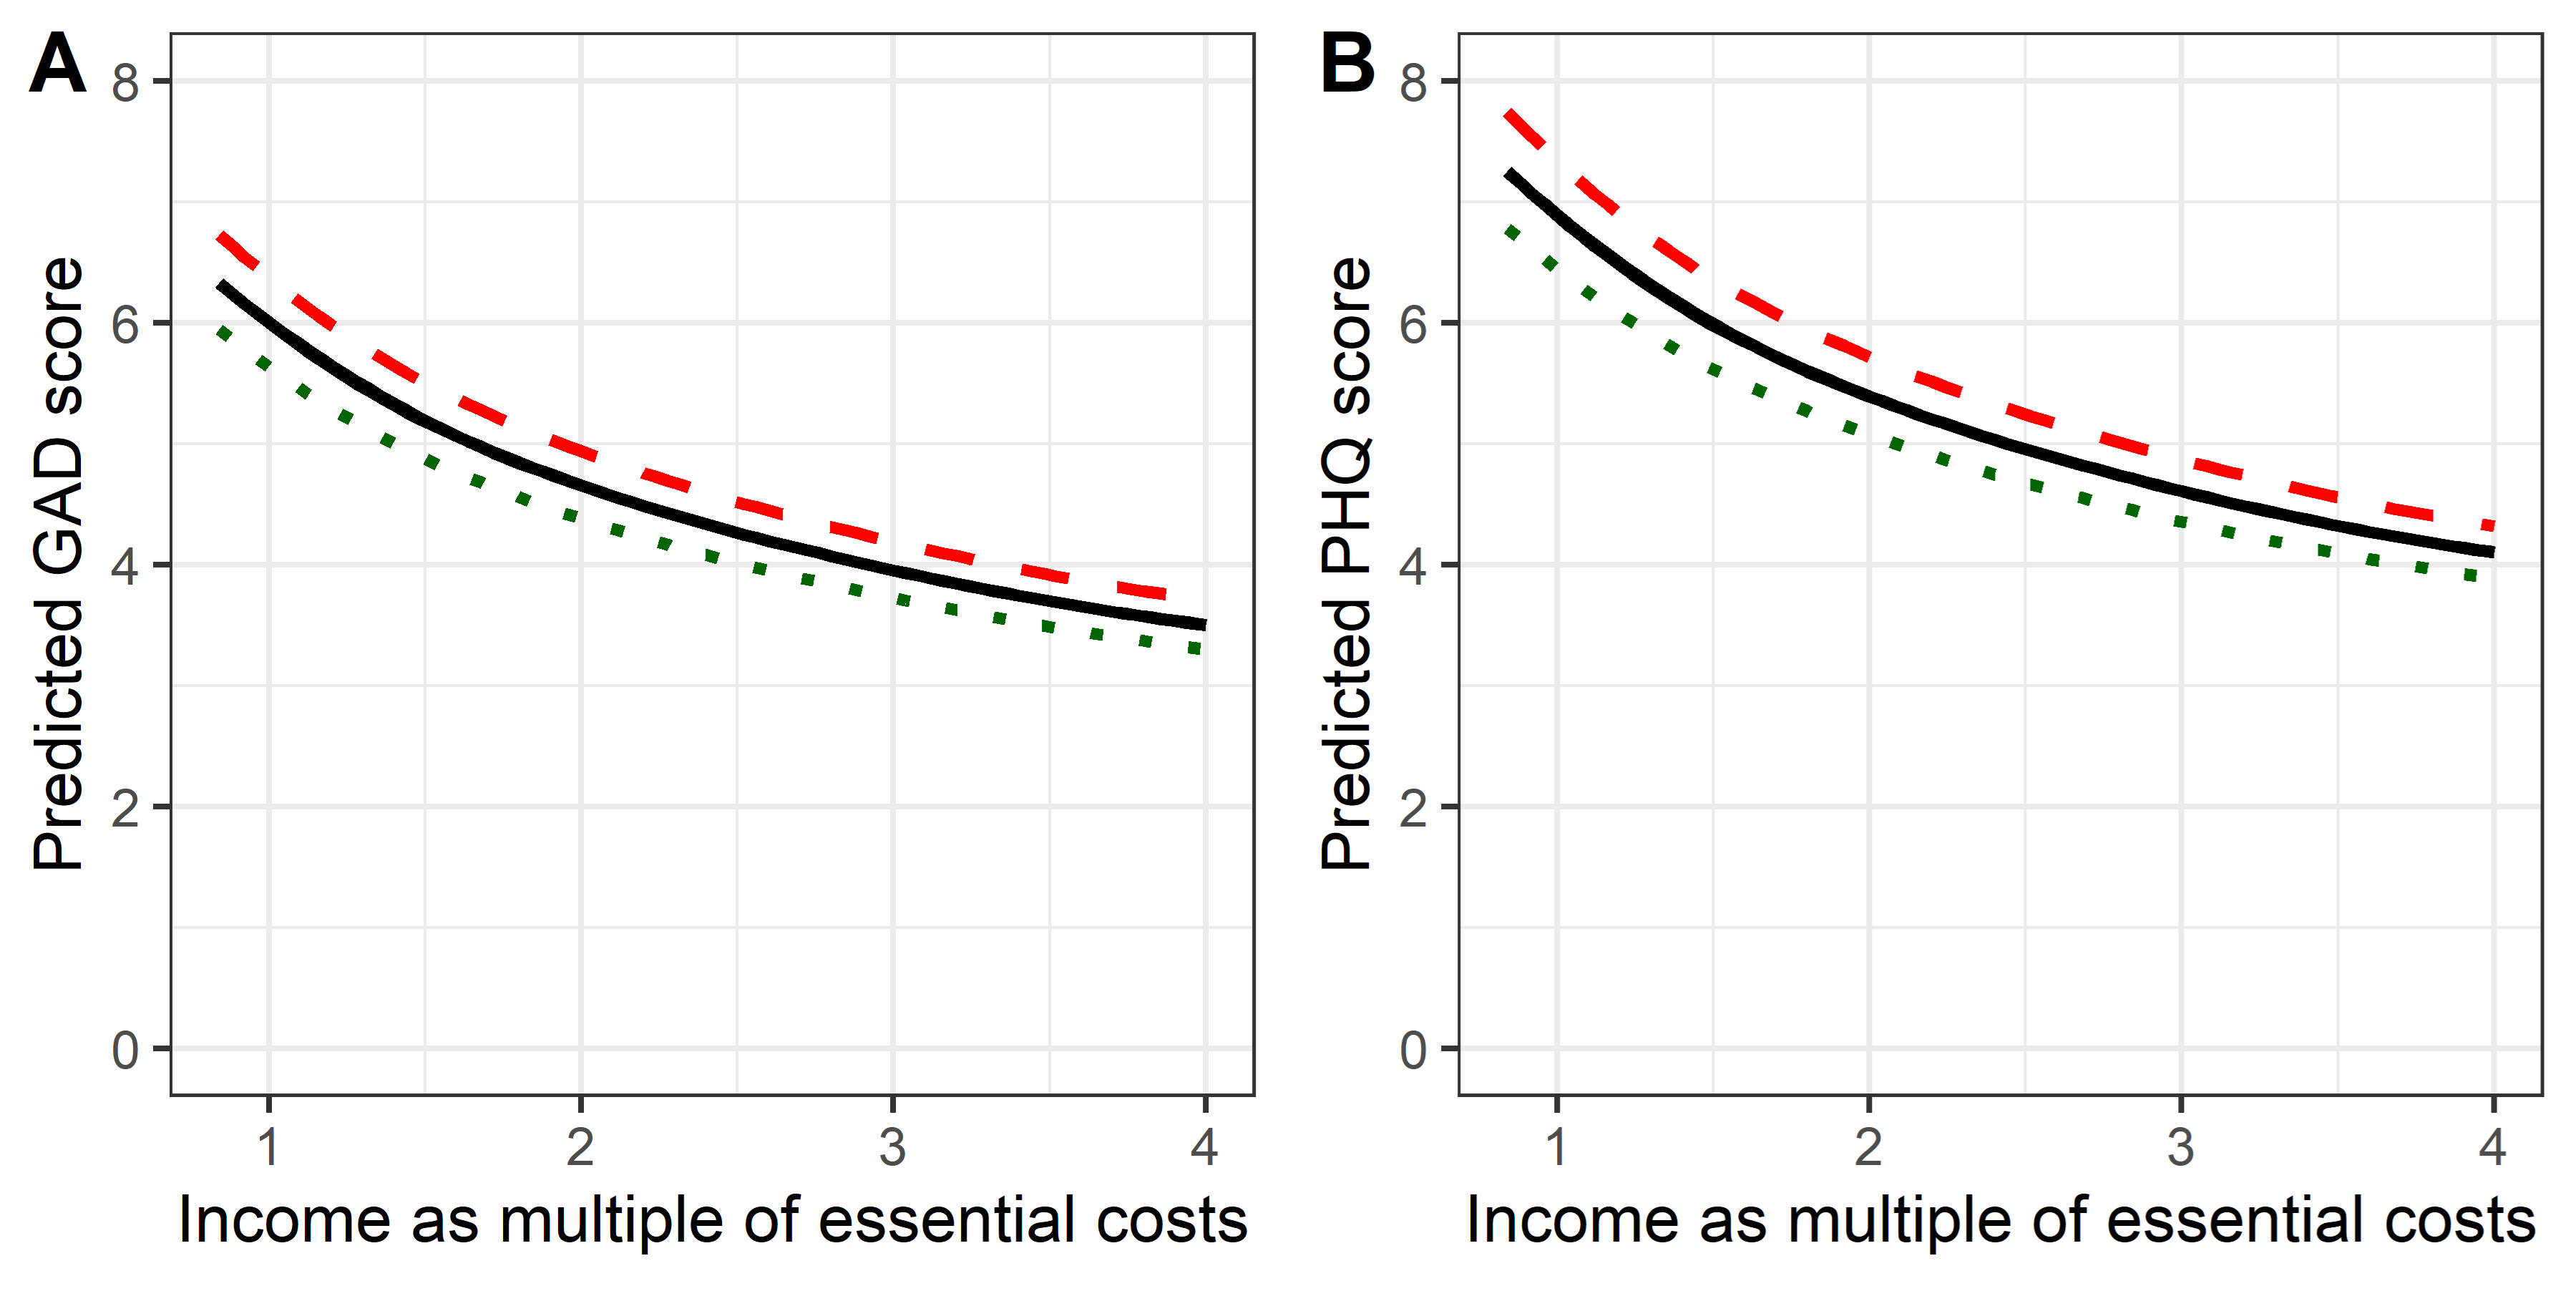
The solid line shows the typical anxiety or depression score for someone whose income is only equal to their essential costs (1); for whom it is twice their essential costs (2); or 3 or 4 times. As you can see, the lower your average income-to-cost ratio, the greater your symptoms (this is the answer to the average position question, above). But the dotted and dashed lines show what happens when a person’s income-to-cost ratio fluctuates from their typical value: a month where things are twice as good as normal (green dots) or only half as good (red dashes). This is the answer to the fluctuation question: yes, in a month where you finances are less good than usual, your mental health is less good than usual too.
The within-person month-to-month associations are about one quarter the strength of the between-person differences. That means that if I double your income overnight, I will (extrapolating from our analysis) make your anxiety and depression immediately better; but I will only make up about 25% of the expected difference between you and someone whose income has always been twice yours. There are different ways to think about why this is the case, but the easiest one for me is the assumption that a lot of the bad things about poverty are cumulative: one month of shortfall is manageable, two months is harder, three months is worse, and so on. In this light, the fact that you can get as much as a quarter of the overall effect in a single month is striking.
Of course, conclusions about causality without performing a true randomized trial must be tentative. We present additional analyses and consider alternative interpretations in the paper. But I do feel these data, simple though they are, support an emerging (actually, re-emerging) view of anxiety and depression as conditions that should be conceived of socioecologically. That is, though the causality is undoubtedly complex, we should not rush to the brain of the depressed individual as the sole causal focus, still less to drugs (or for that matter cognitive behavioural therapy) as the only relevant types of possible intervention. That brain is responding to socioecological factors: the distribution of material resources in the environment, power, social support. Those are the main causes of the causes. If we understand and influence the distribution of those things in the population, our potential effect on population health is immense. Yes, the effect of an income fluctuation on depression was only a point or two on a scale; but the same is also true of the effects of antidepressant medications, whose efficacity is measured using similar scales, and which also have very modest effects on average. Multiply the odd point on the scale by the millions of people who find themselves in poverty, disenfranchised, and isolated, and you can see the vast potential for political decisions to improve – or exacerbate – human suffering.
The Changing Cost of Living study was a collaboration and I would like to thank my collaborators and the funders. And of course, the participants, who completed an average of over 10 financial diaries each and stuck with us in great numbers over the course of the year. The work was funded by the French Agence Nationale de la Recherche (ANR); the UK NIHR; the University of York Cost of Living Research Group; and the UK Prevention Research Partnership (MR/S037527/1) collaboration, ActEarly. For a full funding statement, see the paper.
Discover more from Daniel Nettle
Subscribe to get the latest posts sent to your email.