People with lower incomes have worse mental health: more depression, more anxiety. On the face of it, this seems to be a strong pragmatic and ethical case for income redistribution: if we raised the incomes of the poorest in society, we could avoid all the health and social costs of those difficulties, and, more importantly, relieve suffering. The association between income and mental health also seems to ask us to reconsider what ‘mental health disorders’ really are: it becomes less relevant to think of them as principally ‘brain diseases’ or ‘chemical imbalances’, and more compelling to understand them as psychological responses to particular socioeconomic realities.
However, nothing is simple. Lower incomes could be associated with worse mental health for at least three reasons:
- Lower income causes worse mental health;
- Worse mental health leads people to earn lower incomes;
- Some as-yet-unmeasured variable affects both income and mental health (and there are many you could think of).
In a cross-sectional study– that is, a study where you measure income once and mental health once — you really can’t get anywhere much in deciding the relative importance of these three possibilities. A longitudinal study is immediately a bit better. This is a study where you measure income and mental health on multiple successive occasions in the same people. If, when income decreases, mental health gets worse; and when income increases, mental health gets better, then it starts to look like possibility 1. is important. And this is especially true if the reason for income going down is not to do with something the person has done: what economists call an income shock, where some random external event causes income to change. A term researchers use for a situation when a random shock is applied to a load of people is a natural experiment. Instead of the researcher having to delberately apply a treatment to the participants, something just happens to them anyway, and the researcher tries to hang on and learn about cause and effect in the process.
Sadly, in 2022, we are living through a natural experiment about income and mental health. Prices are rising in the double digits. Incomes are not (except, apparently, for chief executives of large corporations, their incomes rose by 23% last year). Many of the things whose prices are rising fastest are not discretionary items, in particular the energy needed to cook and stay warm. What matters for wellbeing is not income per se, but non-committed income: the income you have left over after you have dealt with the things you must maintain in order to maintain your identity and basic subsistence. non-committed incomes in countries like the UK and France are going, by all projections, to fall for most people over the coming period, for reasons that really aren’t of their making. If possibility 1. – income affects mental health – is true, then, sadly, mental health is going to get worse for a lot of people.
In view of this natural experiment, a consortium of colleagues (Coralie Chevallier, Matthew Johnson, Elliott Johnson, and Kate Pickett) and I have organised a hastily assembled longitudinal study, The Changing Cost of Living Study. We have recruited small cohorts of about 250 volunteers in the UK and France, and we are going to be in touch with them every month over the coming year, to understand how their psychological states are changing with the economics of their households. To be clear, we don’t wish to profit intellectually from people’s misfortunes. But these things are happening to them anyway. As socially committed researchers, we wish to document the effects, and bear witness, to anyone who is prepared to listen.
The Changing Cost of Living Study only started last month, so we don’t have any longitudinal results yet. However, we have the baseline responses from our participants. These allow us to get to know our cohort a bit, and do a cross-sectional study at the outset. I’ll be presenting some of those cross-sectional results in this blog. For those of you who are interested, the protocol of the study is pre-registered here.
A central input measure in our survey is non-committed income, the amount of income you have left over once your unavoidable obligations (taxes, rent or mortgage, water and energy) are paid for. We calculate this each month from what our participants told us came in to their household, minus what they had to pay in mortgage or rent; council tax; water; and energy bills. We equivalise this for the number of people in the household (in other words, we take account of the fact that a household of 4 needs more money than a household of 2). And then, for display purposes, we divide people into quintiles (the 20% with the lowest non-committed incomes, the next 20%, and so on to the top of the distribution).
On the output side, there are many measures. We are particularly interested in depression, anxiety, time preference, and risk preference (more on these below). For depression and anxiety, we use clinical scales that were developed in the context of deciding if people had levels of clinical concern, and might need drug treatment. So, substantial scores don’t represent mild complaining about life, but potentially serious suffering.
Just about managing?
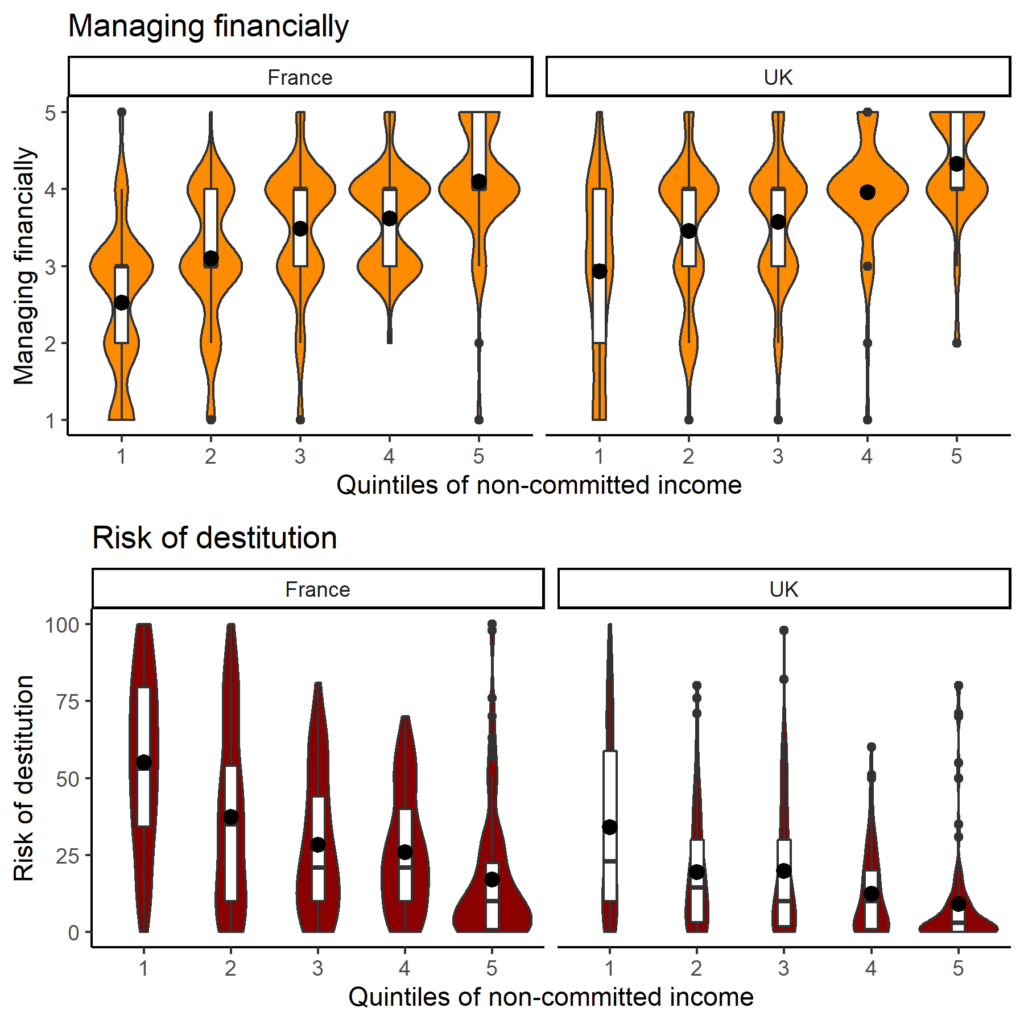
First, let’s look at how people are managing to get by. We asked two questions: how are you managing financially (where 1 is not at all, 5 is very well); and how do you estimate your risk of destitution (grande pauvreté in French). As you can see in figure 1, in both countries, our cohort spans the socioeconomic distribution pretty completely: the people in the lowest quintile are really struggling to get by, and seriously worried about destitution; whilst the people in the top quintile are doing pretty well. The people in the lower non-committed income quintiles are having a harder time in the France than the UK (for example, in the lowest quintile in France, the average subjective risk of destitution is 50%), but we can’t conclude anything about the difference between the two countries in general. We recruited in a different way in each case, and it just reflects the different samples that joined the study.
Depression and anxiety
Figure 2 shows the levels of depression across the income quintiles. These scales are typically cut up into ‘none’, ‘mild’ and ‘moderate-severe’, where ‘moderate-severe’ indicates clinical concern that might well lead to medical treatment (‘mild’ might too, sometimes). The first thing that might strike you about this figure is that the population as a whole is not doing too well: there are more people with some level of depression than without, in both countries. This is not an uncommon finding these days; and at the moment, there is quite a lot to be ‘depressed’ about.
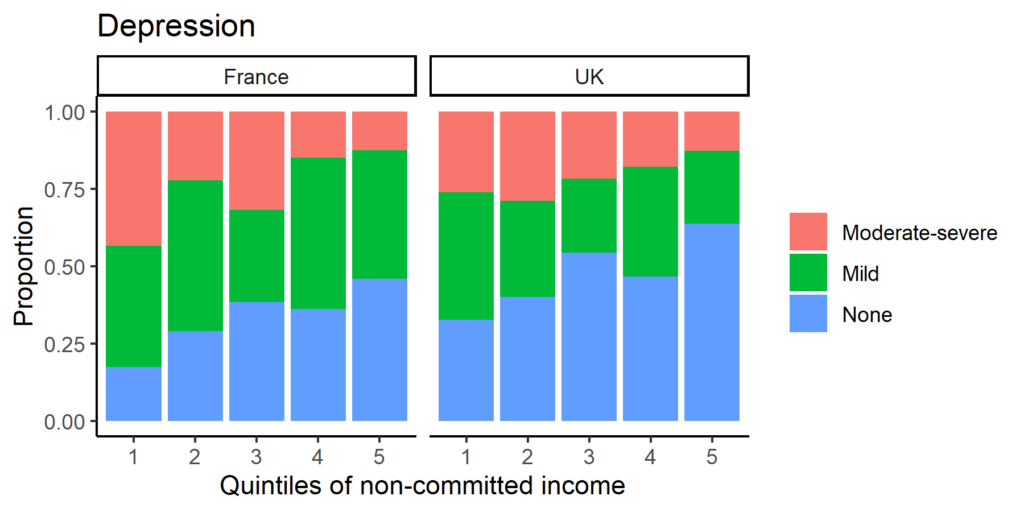
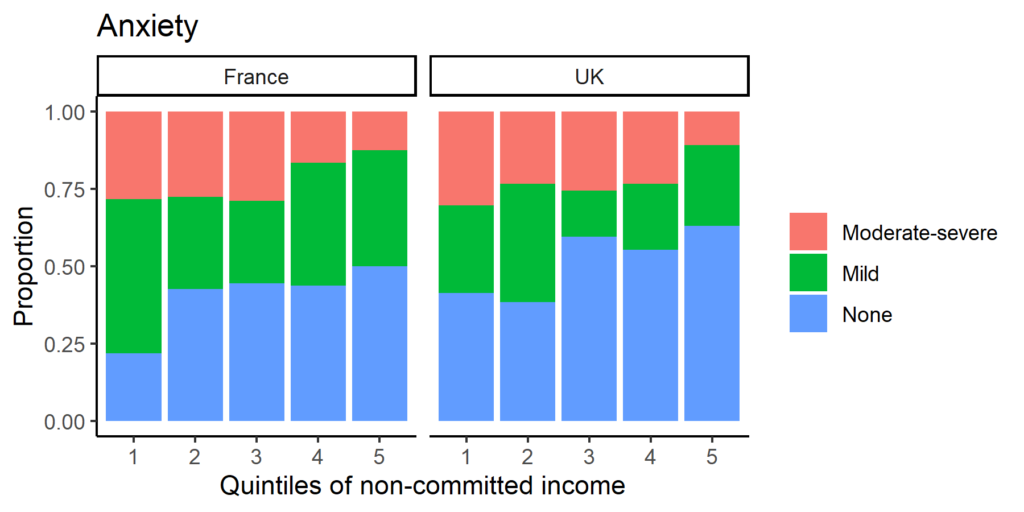
Central to the question here, however, is how the rate varies across the quintiles. You see this most clearly by looking at the heights of the ‘none’ bars. These are highest in the highest income quintile, and lowest in the lowest. In the bottom 20% of the distribution, most people have some level of depression, and for a big chunk of them, it would be classed as moderate or severe. Anxiety tells a very similar story (figure 3; and indeed, despite their different names, depression and anxiety go closely together in most regards).
Can’t afford to wait?
We’ve also asked about time preference (would you prefer a smaller, immediate amount of money over a larger one that will come in the future?) and risk preference (would you prefer a smaller, sure amount, or a gamble that could produce nothing or could produce a lot?). Figure 4 shows how those measures distribute across the income quintiles.
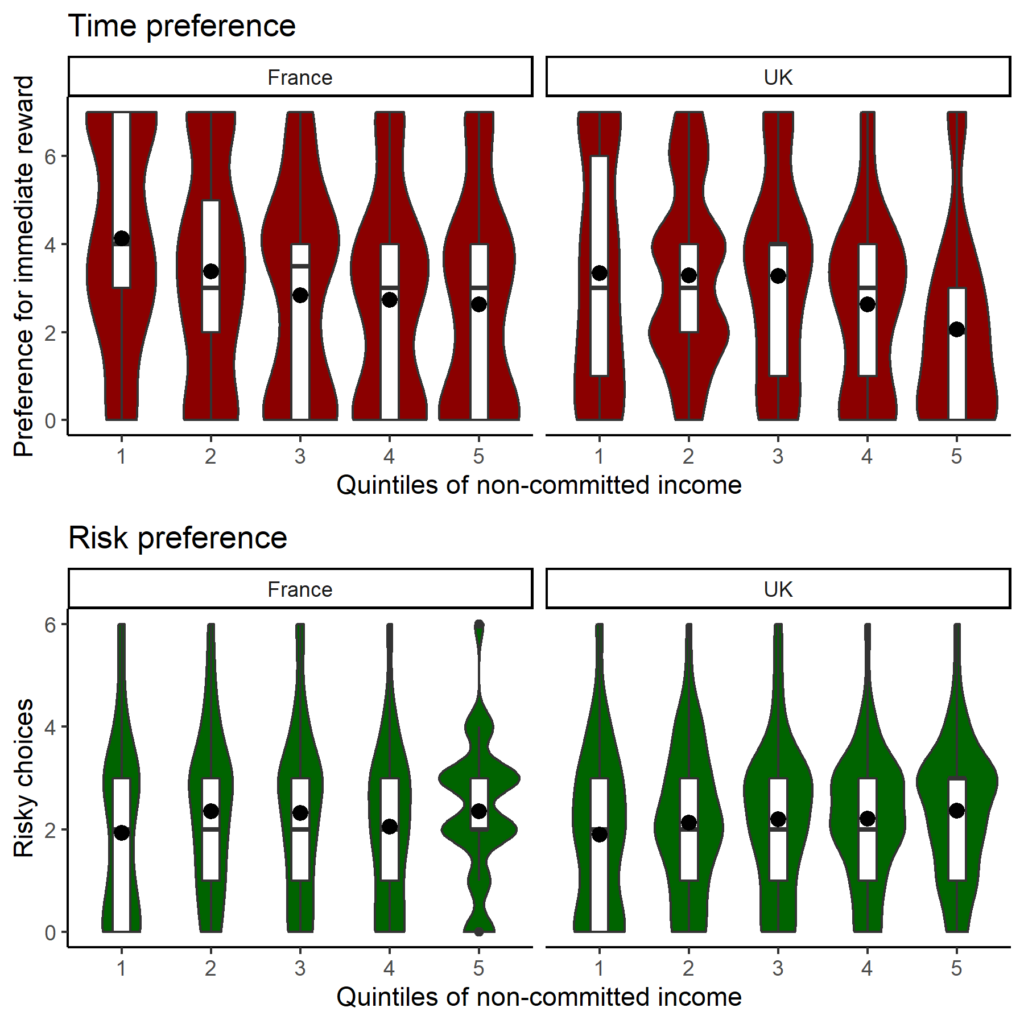
Figure 4. Time preference (top) and risk preference (bottom), by non-committed income quintile and country.
For time, we reproduce the common finding that people whose non-committedincomes are lower can’t afford to wait. This makes sense; if you are worried about paying this month’s rent, you are simply not in a position to make an investment that does not pay off for several months. This is a kind of tax of poverty: you can never afford to do the things that affluent people can do that will make them even more affluent in future, because you are always using all your resources to fight the immediate fire.
For risk preference, the pattern is not very clear, but there might be a hint that people with lower non-committed incomes are more averse to risks (i.e. prefer a sure thing over a gamble). This again makes sense and concurs with previous findings: if one euro to spend could make a big difference for you, you can afford to invest that euro in a risky gamble. On the face of it, you might think risk-taking is a bad thing, and therefore that risk aversion is a desirable consequence of poverty. However, to work well, society needs people to take risks: to set up new companies, invest in developing rare skills, move to new places. People in poverty may not be able to afford to do this, even if it would be socially beneficial, since they don’t have the buffer for the case where it goes wrong. So they are often stuck not able to make the individually and socially useful moves they might wish to make.
These are some of our findings at baseline (there are plenty of other measures; contact me if you want to discuss the study further). It looks like we find more or less cross-section income gradients that we might expect. But the real value of the study will be longitudinal. We look forward to understanding how things change over the coming months, especially with winter coming and energy bills rising. We will report ongoing findings here. In the mean time, we would like to thank our participants for joining us in this endeavour, and our funders for allowing it to happen.
The Changing Cost of Living Study is funded by the University of York Cost of Living Research Group; the ActEarly Collaboration (UK Prevention Research Partnership), and the Agence Nationale de la Recherche (ANR-21-CE28-0009). An ongoing results webpage can be found at: https://rpubs.com/danielnettle/ccol. This shows the descriptive statistics from the cohort and will update automatically each month.
Discover more from Daniel Nettle
Subscribe to get the latest posts sent to your email.